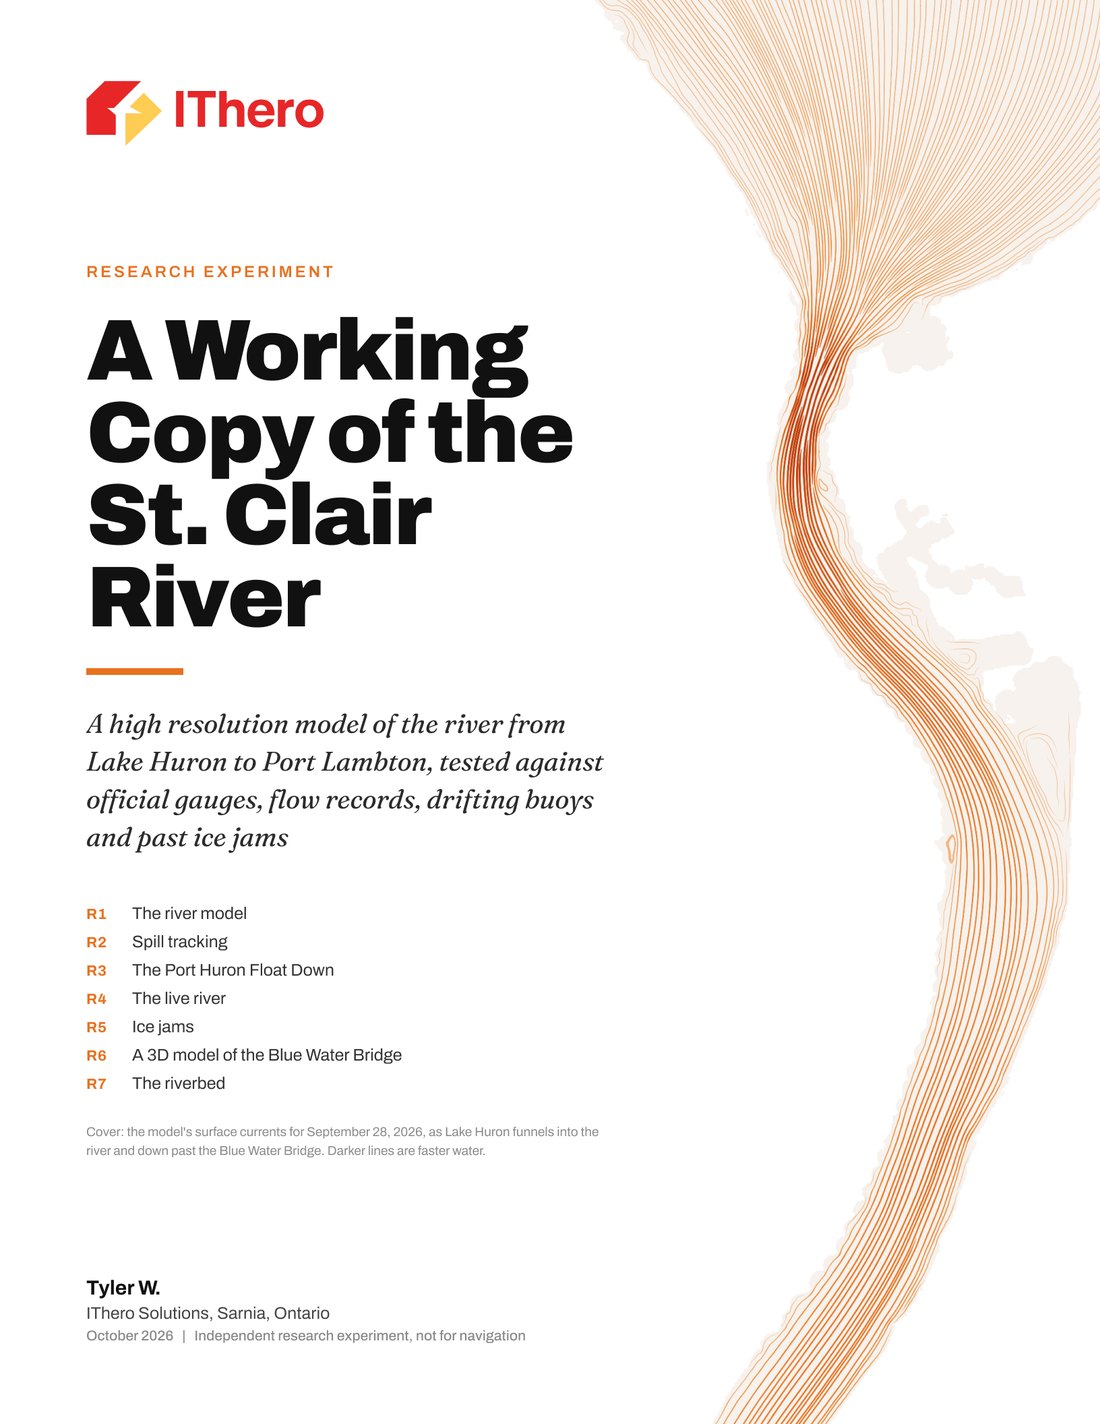
Every second, more than two Olympic pools of water leave Lake Huron and pass under the Blue Water Bridge. The St. Clair River carries the outflow of Lakes Superior, Michigan and Huron, and it runs past Sarnia’s industrial corridor, two First Nations, and the drinking water intakes of towns on both sides.
Over the past weeks IThero has run an independent research experiment on it: a computer model of the river, 42 km from Lake Huron to Port Lambton, tested against official measurements at every step. This post explains what it is, how it was tested, what it can do, and what is not finished yet.
Two weeks of water levels, Sept 30 to Oct 14, 2026: measured at five official gauges (black) against the model (orange).
What it is
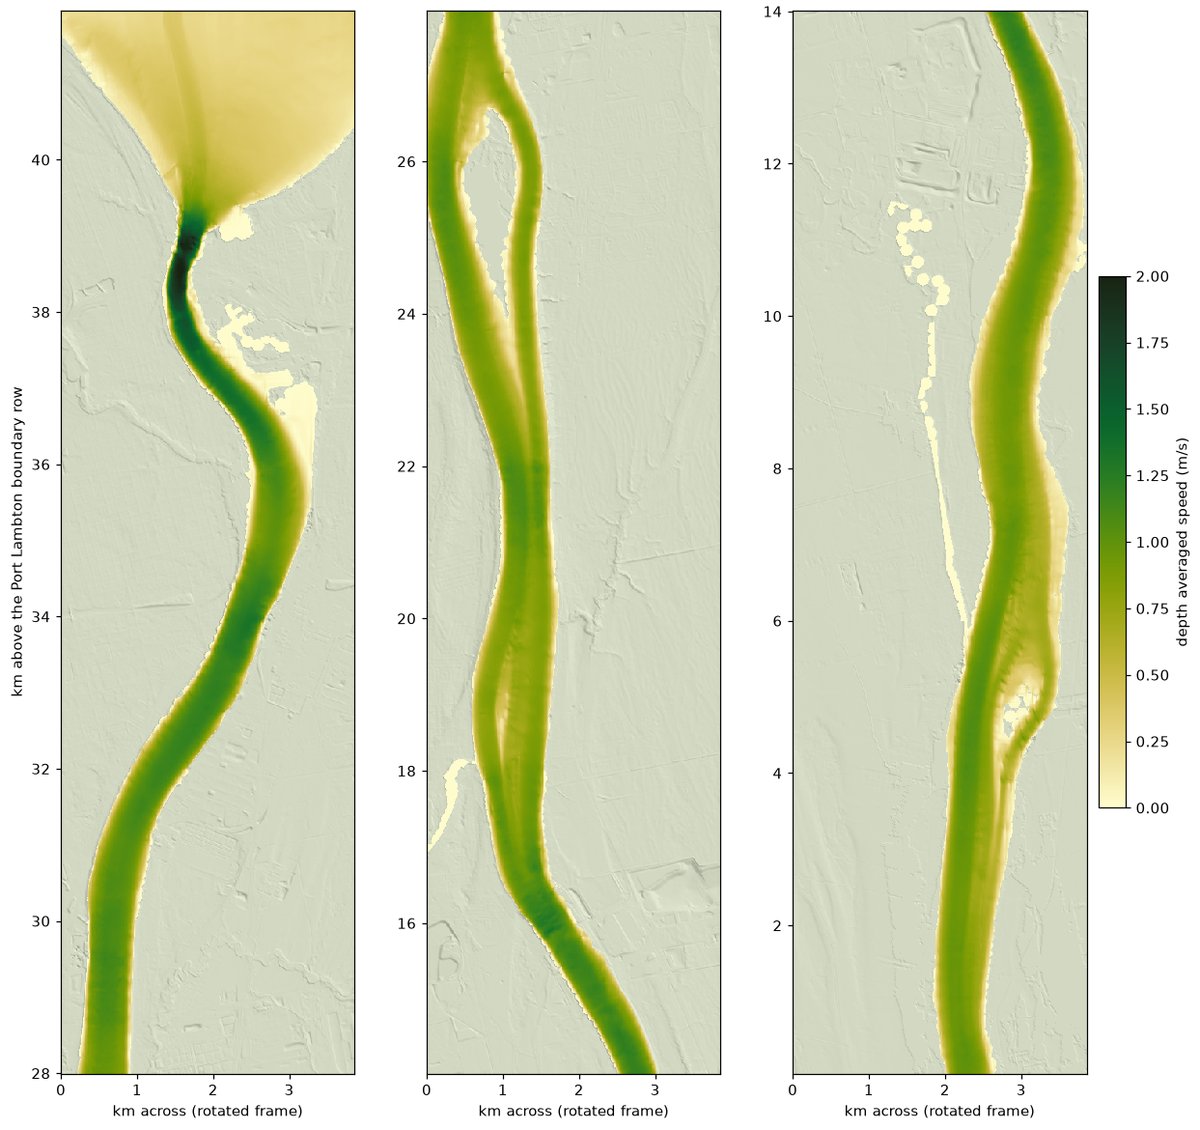
The model’s riverbed comes from more than fifteen depth surveys by US and Canadian agencies, joined to laser maps of both shorelines. The river is divided into cells 10 m across, about half a million of them, and 5 m across for the finest work. For every second of river time the model works out, in every cell, how deep the water is, how fast it is moving and which way it turns. It runs on a single computer here in Sarnia, and two weeks of river take under an hour of computing.
How it was tested
A picture of a river is easy to make. The point of this work is a model that behaves like the river, so every result was set beside an independent measurement:
- Water levels. Over two weeks, driven only by the measured levels at Lake Huron and Port Lambton, the model stayed within 2.3 cm on average of five official water level gauges, including one it was never tuned on.
- Flow. The flow it works out from those levels alone matched the US Geological Survey record to within half a percent.
- Far from its tuning. At real low and high water (2012 and 2020) and in 2000, it held within 4.3 cm of the gauges.
- Drifting buoys. In October 2000 US scientists released 173 drifting buoys in this river. The model’s floats ended up a median of 40 m from the real ones after ten minutes.
- Currents. In 2002 US Geological Survey and Army Corps crews measured the current by boat across the river from Lake Huron to Port Lambton. Point by point, the model’s speeds were 2% fast on average, with a typical miss of about 0.1 metres a second (half of the measured stretches within 0.05), and its directions were within about 2 degrees on the median. It passed all six pass marks set before the test. A simple estimate that shares each section’s flow across the river by depth alone, with deeper water running faster, passes them too; the model’s typical miss is about 30% smaller (0.10 against 0.15 metres a second). It clearly misses in the 1.1 km just below the Blue Water Bridge, where the fast water hugs the Michigan shore more tightly than the model has it. Experimental, and not for navigation.
- Spills. Against all 15 release points in NOAA’s official spill reference tables for this river, arrival times for surface releases land within a few minutes on the median. Against three real dye releases in 2009, first arrival was 44 to 56 minutes late; rerun with the faster surface current, two of the three arrived within 14 minutes and the third 21 minutes late.
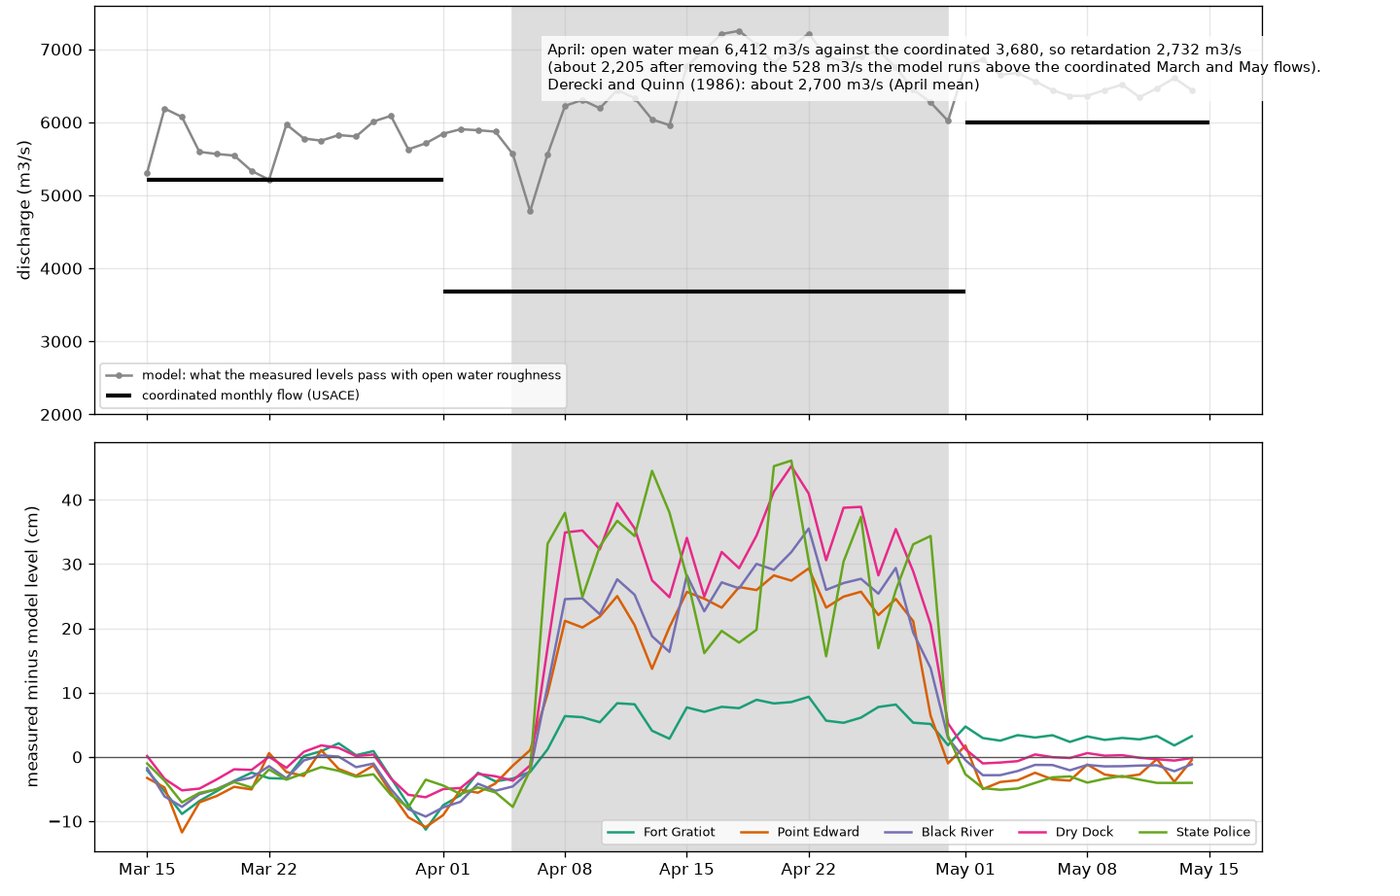
- Ice jams. From routine gauge records alone, it found the January 2019 and February 2021 ice jams on the days they were reported.
The full lab reports record every check, including the ones the model failed.
What it can do
Spills. If something spills into the river, how long until it reaches each intake downstream? The model follows a release from any point on the river, at whatever flow the river is running, and can run seventeen scenarios at once, in minutes rather than from a fixed table.
Ice jams. Using routine gauge records, the model estimates how much water an ice jam is holding back. The January 2019 jam held back about 1,970 cubic metres a second at its peak, about a third of the river. For the record jam of April 1984, the model finds 2,200 to 2,730 cubic metres a second held back over the month, against the 2,700 published by the scientists who studied it in 1986.
The riverbed. The current presses hardest on the bottom from the Blue Water Bridge to the first bend, 8 to 13 pascals, in line with the 2009 international study of this river. That is the information behind any crossing, intake, dock or shoreline work.
A closer look at the bridge. A full three dimensional model of the bridge reach, seven million cells 2 m across, shows the surface running about 14% faster than the river’s average, the number that decides where floating material goes.
The river right now. The same model can take the latest public gauge readings and show what the river is doing at this moment. Replayed hour by hour over the week of Oct 14 to 20, it stayed within 2.3 cm of the gauges on average and within 1% of the measured flow. Experimental, and not for navigation.
What is not finished, said plainly
- The finer 5 m version, fixed and retuned on Oct 20 and 21, has now run the full two weeks: it follows the gauges about as closely as the 10 m version, not better, with slightly larger average offsets (largest 3.0 cm, against 2.4 cm).
- The three dimensional bridge model loses about 5 cm too much water level through the reach, because its walls are built of small steps. Smooth walls are the fix.
- Ice is modelled as extra resistance in each reach of the river, not yet as individual ice cover, and the delta below Port Lambton is not in the model yet.
- The live river view runs on demand, not yet on a schedule.
Who it could help
Emergency planners on both sides of the river, the plants and utilities along it, the First Nations communities on the river and at the delta downstream, drinking water operators, and researchers. The questions it answers are the practical ones: where a spill goes and when it arrives, what the ice is doing, and how hard the river works on its bed.
What comes next
The same model can be carried down through the delta to Lake St. Clair, zoomed into a single intake or crossing in full three dimensional detail, paired with weather forecasts to look ahead, and set to watch the gauges around the clock. Conversations are welcome with anyone in the region who works on or near the river.
Read more
- The short version (PDF, 5 pages): the story, the checks and the limits.
- The validation edition (PDF, 43 pages): every check set beside the measurement it was tested against, with its verdict and limits.
- The full lab reports (about 230 pages) are available to researchers and partners on request. Get in touch.
Data from NOAA, the US Geological Survey, the US Army Corps of Engineers, the Canadian Hydrographic Service, the Water Survey of Canada, Natural Resources Canada, Environment and Climate Change Canada and USDA aerial imagery. Developed with the help of artificial intelligence. An independent research experiment by IThero Solutions, Sarnia; experimental and not for navigation.